Creating an objective performance management process is often easier said than done. While managers are objective in isolation, multiple managers perceive performance differently, creating a subjective set of performance data, and by extension, subjective data leads to subjective outputs.
In addition, linking behavioural and performance management data to financial outcomes is rarely straightforward.
In addition, linking behavioural and performance management data to financial outcomes is rarely straightforward.
 4G Relationship Friction resolves the problem of subjectivity and makes it possible to link performance management data to financial outcomes.
 To complement Relationship Friction, the use of Social Relationships provides a qualitative framework and the basis of an objective performance management process to further understand what's really driving people's performance.
Objective Performance Management
How it Works
 Empirical research into 4G validates the fact that the 14 Social Relationships can be ordered from most to least productive. By combining this rank order of Social Relationships and linking the corresponding ratios to people's salary, it is possible to calculate the financial cost of relationships and to return quantifiable measures of team performance and efficiency, as shown by the Relationship Friction metric.
 Relationship Friction calculations provide a formula to link the outcome of various business processes to KPI’s and other quantifiable measures of performance.
Objective Performance Management
In Practice
In diagram 1 and the table below, a random team of 7 is analysed using Relationship Friction. Everyone in the team is paid £50,000, making the total salary for the team £350,000. Given the 7 Social Profiles and the breakdown of the 21 Social Relationships, the cost of Relationship Friction for this team is £60,195 or 17.2% of the total team salary. In addition, the Relationship Friction Index is 864, allowing Relationship Friction data to be compared across different teams without revealing sensitive salary data.
| Name | Social Profile | Salary |
|---|---|---|
| Alberto Boeder | 3Ni | £50,000 |
| Fraser Corking | 4Ne | £50,000 |
| Gayle Rhodes | 2Se | £50,000 |
| Lashanda Kumar | 1Si | £50,000 |
| Leanne Woods | 2Ni | £50,000 |
| Louise Calvert | 4Te | £50,000 |
| Tejash Thiara | 3Fi | £50,000 |
| Total Salaries | £350,000 | |
| Relationship Friction | £60,195 | |
| Relationship Friction % | 17.2% | |
| Relationship Friction Index | 864 |

Diagram 1 - Click to Enlarge
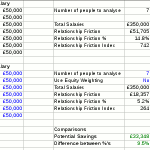
The second example allows a comparison with the first and allows a 'before' and 'after' scenario to be shown. In this instance, the comparison might be between two different customer service teams, but could equally compare two teams of accountants or two sales teams.
The second table and diagram 2 show the change in Relationship Friction if the team of 7 is optimised around a particular Social Group, in this case, Social Group 3. By creating a team in which everyone is a member of the same Social Group, not only does everyone experience optimal Social Relationships, but the Relationship Friction figures improve dramatically. In this case, Relationship Friction falls to £18,357 or 5.2% of the team’s combined salary. This is a difference in Relationship Friction of £41,838, or a fall of 12%. Likewise, the Relationship Friction index falls to 264.
The second table and diagram 2 show the change in Relationship Friction if the team of 7 is optimised around a particular Social Group, in this case, Social Group 3. By creating a team in which everyone is a member of the same Social Group, not only does everyone experience optimal Social Relationships, but the Relationship Friction figures improve dramatically. In this case, Relationship Friction falls to £18,357 or 5.2% of the team’s combined salary. This is a difference in Relationship Friction of £41,838, or a fall of 12%. Likewise, the Relationship Friction index falls to 264.
| Name | Social Profile | Salary |
|---|---|---|
| Alberto Boeder | 3Ni | £50,000 |
| Claudia Robinson | 3Fi | £50,000 |
| Hugh Morton | 3Se | £50,000 |
| Ivan Thomas | 3Se | £50,000 |
| Jim Rushton | 3Ni | £50,000 |
| Mark Correra | 3Te | £50,000 |
| Tejash Thiara | 3Fi | £50,000 |
| Total Salaries | £350,000 | |
| Relationship Friction | £18,357 | |
| Relationship Friction % | 5.2% | |
| Relationship Friction Index | 264 |

Diagram 2 – Click to Enlarge
While the examples above help illustrate the changes in the ‘before’ and ‘after’ scenarios, not every use of Relationship Friction requires the use of a team creation process. Relationship Friction can be applied to existing teams just as easily.
Objective Performance Management
Return on Investment
The ability to link typically intangible factors such as relationships and group values to salary data and to show this information as a financial cost and in a quantifiable manner makes it easy to show the financial impact and ROI from a number of different people management processes and interventions.
Recruitment, team creation, organisational re-design and changes to business process all benefit from the ability to show an ROI as a result of any improvements and optimisations. Other examples include sales, customer services, process throughput/process efficiency and project based tasks.
Recruitment, team creation, organisational re-design and changes to business process all benefit from the ability to show an ROI as a result of any improvements and optimisations. Other examples include sales, customer services, process throughput/process efficiency and project based tasks.


